It’s a little known fact that us Brits wear just 70 per cent of the clothes that we have stored away in our wardrobes, which leaves us with a total of 1.7 billion unused items. On average, a consumer keeps their garments for three years, but even more shocking than this is the fact that something might be frequently worn in the first year, and then phased into the stockpile of unworn clothes later on. That is why the average British closet is so overstuffed: we don’t wear all of the clothes we own.
The spending habits of the average person in the West have changed dramatically over the last hundred or so years when it comes to buying clothing. Between 2002 and 2003, for example, people in the US spent, on average, four per cent of their income on clothes, whereas back between the years of 1934 and 1946, clothing used up 12 per cent of people’s incomes. The current average expenditure per item in the USA is $14.60. Don’t go thinking that we are all consuming less though. On average, just one person in the UK will produce 70 Kg of textiles waste per year – that is a lot of clothing. Cheap, fast fashion means we are spending less yet buying more.
So, what will happen after you clean out your closet?
The best way to rid your wardrobe of unwanted clothes is to donate them to a charity shop, as this generates revenue for the charity.
Donated garments are sold in charity shops, but any clothes that aren’t sold will be resold to the used-clothing industry. These clothes are sorted into piles based on potential markets (type, condition of the clothes, and fabrics). The sorting process is actually quite labour-intensive because it is often done by hand. After sorting, the clothes will be distributed all over the world, but in fact, most of them end up in countries such as Poland, Ghana, Kenya, and Benin. So, what begins as a charitable donation can end up as a trading commodity.
Although this process is good for the charity, it could be argued that this process destroys the textile industries of importing countries. In fact, as a result of this issue, over 30 African countries have actually prohibited import embargos of used clothes.
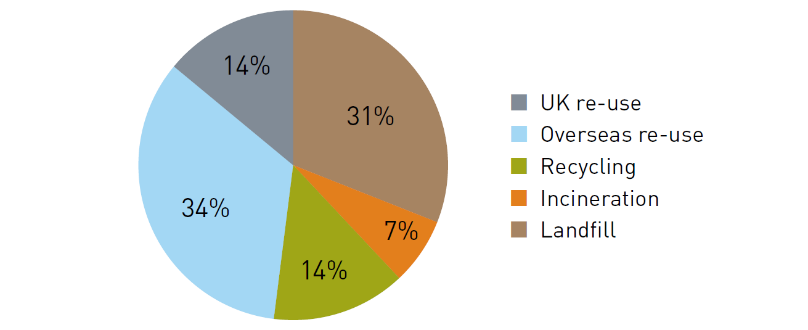 Destinations of end-of-life clothing (Wrap)
From the sorting process, there will also be unwearable garments left over. These are sold to “shoddy industries”.
These industries disassemble garments into shreds, fibre or rags. It is a mechanical process that breaks down clothes with carding machines into fibre components; producing less material than before. These materials are then used as a stuffing in coffins, mattresses, and upholstery. An innovative company, IRIS Industries, is currently using these shredded materials and converting them into furniture or countertops.
Clothing statistics in the UK
- The average UK household spends more than £1,800 (£1,700 purchasing clothes + £130 on laundry) per year
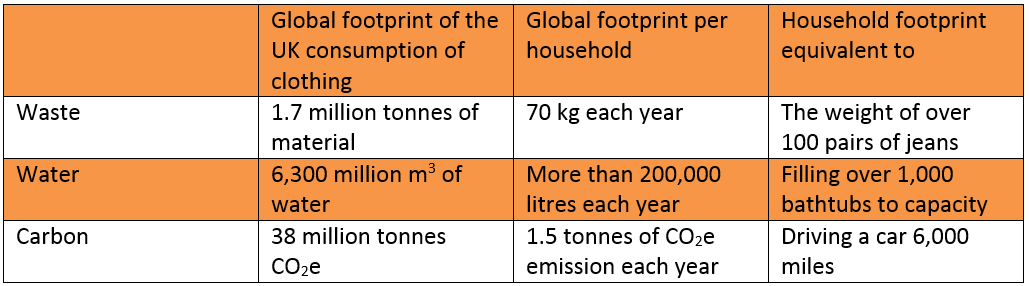
- Every household emits around 1.5 tonnes of CO2e (carbon dioxide = indicator of global warming potential) from their new and existing clothing – a carbon footprint that is equal to 6,000 miles travelled in an average modern car
- 90 per cent of the water footprint of UK clothing is made overseas
- The CO2e emitted by us washing and drying our clothes in the UK equals 10 per cent of the amount of CO2e emitted from cars across the country.
The following table shows a summary of the waste, water, and carbon footprints associated with clothing in the UK each year:
As we all know, aluminium cans can be recycled and formed into new cans, but what about clothing? In fact, just three per cent of our old garments are sold for recycling and reclamation into textiles. It is a very complicated and difficult process, as synthetic fibres are melted (a chemical process) and respun to the same length as virgin fibres, with no loss in quality. This process creates nylon and polyester. Making rayon uses less energy than producing new synthetic fibres (80% less GHG).
The recycling and reclamation of wool or cotton clothing is even more complex, and it is sadly necessary to combine them with virgin fibres to achieve a marketable quality.
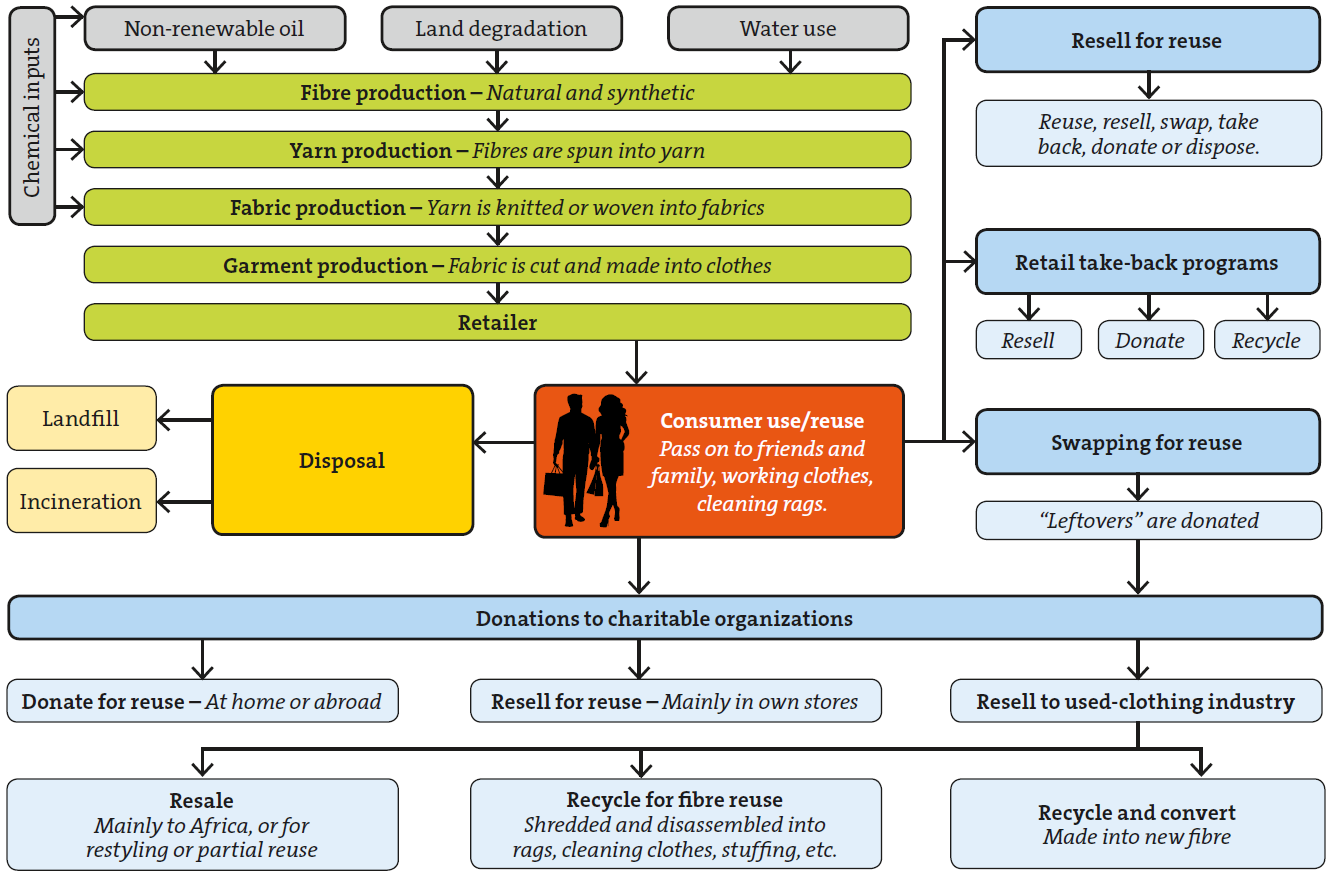 Clothing Life Cycle: Creation, Disposal & Reuse.
Textile waste around the world

China:
The demand for textiles keeps rising worldwide, especially in China – the country which produces much of the material that ends up in landfills.
According to Xue et al. (2014), around 3.5 to 4 per cent of the world‘s waste materials are waste textiles in China’s cities. Furthermore, it is predicted in “The Twelfth Five Year Plan” that the production of waste textiles will exceed 100 million tonnes in China. This means that 70 million tonnes of chemical fibres and 30 million tonnes natural fibres will be used.
China has 26 million tonnes of textile waste annually, but utilises less than 2.6 million tonnes (that is 10 per cent) without even been reused.
But what about other countries?
Germany:
Germany collects and recycles 800,000 tonnes (42%) of waste textiles annually; 40% of these are second-hand clothes, and 25% are used as scrubbing clothes.
Japan:
Japan creates about 1 million tonnes of waste textiles every year, but only 120,000 tonnes (12%) are collected and recycled because they are unable to expand on their textile waste collection services.
USA:
It seems that people in the USA are generally very accepting of wearing second hand clothes. The USA creates 1.2 million tonnes of textile waste annually, which equates to 15% of total US clothing sales. More than 50% of this used clothing is donated to charity, and 226,000 tonnes of waste textiles are reused or recycled.
United Kingdom:
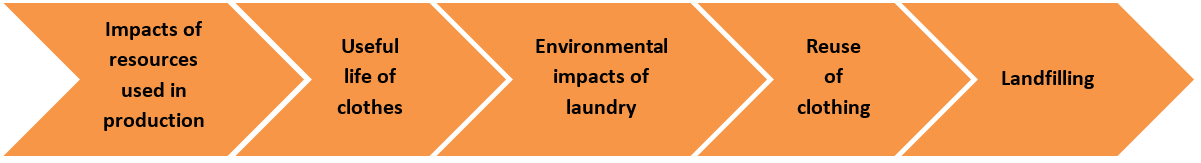
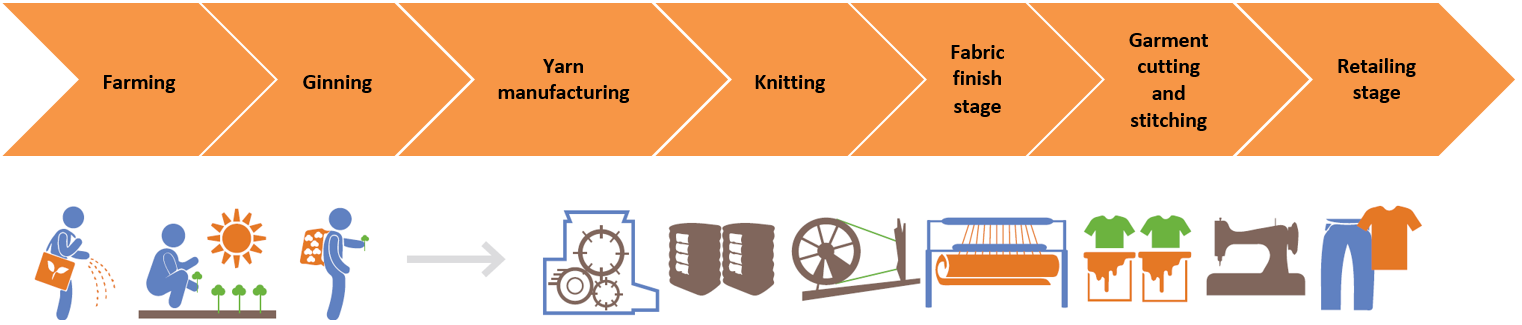
The below examples explain the different stages from upstream to downstream in the supply chain of clothes.
The impact of resources used in production:
Starting from the first stage in the supply chain, from raw material to end product: garment supply contributes 1/3 of the waste footprint; 3/4 of the carbon impact; and the water footprint.
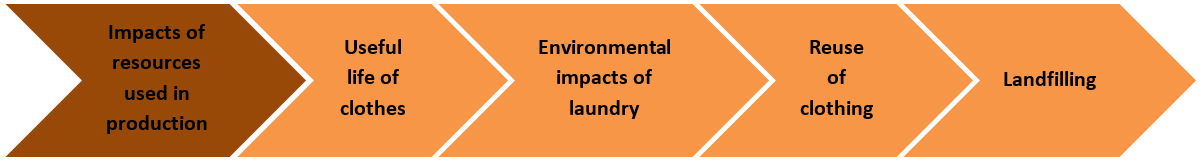
Useful life of clothes:
Approximately 30 per cent of clothes in the average UK wardrobe are unused and worth a total of £1,000 per household, amounting to a massive £30 billion worth across the UK. If we wear items of clothes up to an extra nine months, it will reduce waste, carbon and water footprints by around 20 per cent to 30 per cent, and will reduce the cost of resources by £5 billion (20 per cent).
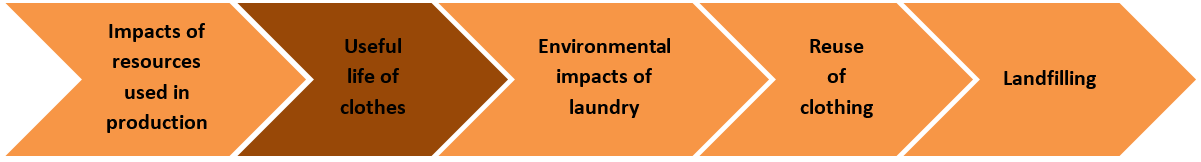
Environmental impacts of laundry:
Laundry produces 1/4 of a household‘s carbon footprint. If every household washed clothes at a lower temperature, less often, and in larger loads, it would save every home £10 a year and cut its footprint by 7%.
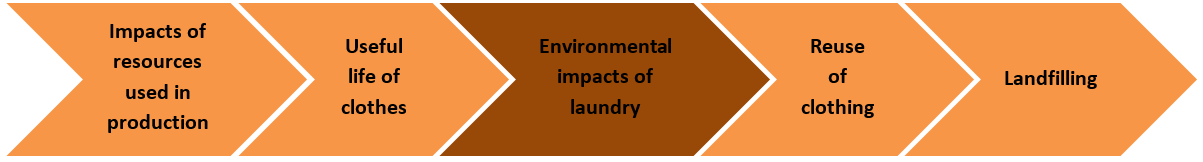
Reuse of clothing:
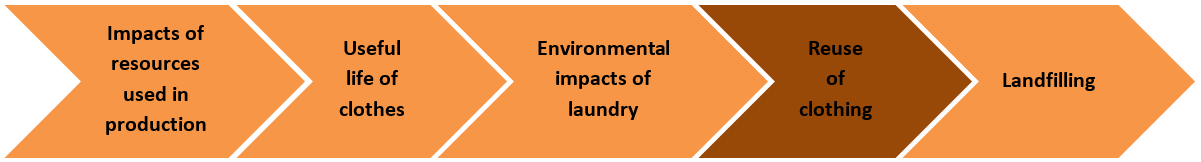
At present, just 50% of clothes items are reused, with 2/3 of these going overseas. However, statistics show that 2/3 of the UK public purchase or receive second hand clothes, which reflects a willingness to reuse.
Landfilling:
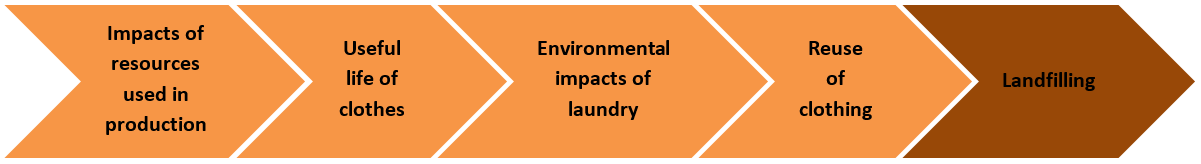
Britons are sending 1/3 of clothing to landfill that would otherwise generate £140 million for local authorities, charities and other organisations.
But what about clothing brands themselves?
ZARA:
Global production covers the worldwide flow of raw materials, all components, and finished products. These characteristics are essential for a fully integrated supply chain. Zara, the big fashion retailer, is a good example of an efficient global firm. The following procedure monitors the geographical integration of the fashion production network of Zara. Zara is one of the largest international fashion companies belonging to Inditex, one of the world’s largest distribution groups. Zara itself has over 2,000 stores strategically located in 88 countries, and its logistics hub is in Zaragoza (northern Spain). Inditex don’t produce goods, but it is Zara‘s main supplier in India, China, and Bangladesh. Recent figures show sales reaching 18,117 million Euros, with 46 per cent of sales being in Europe (excluding Spain). It also has 6,683 shops in 88 markets; 137,054 employees, and a net profit of €5,510 million in 2014.
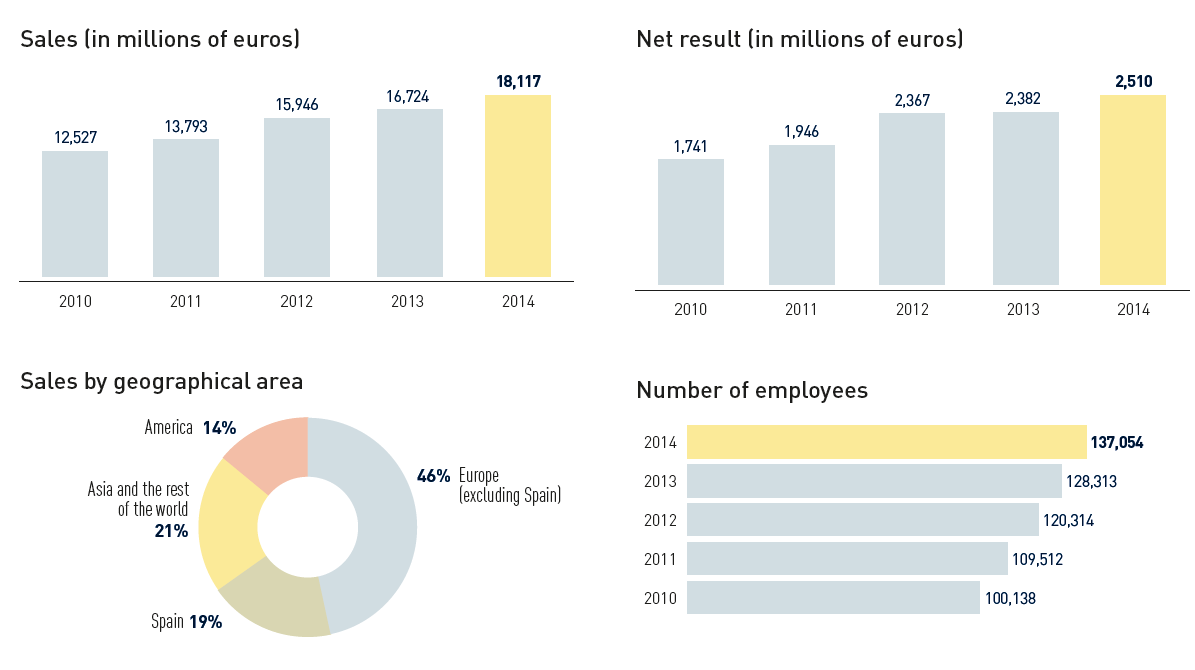 Relevant data of Inditex
These shops are receiving goods twice a week, including new items adapted to local demands. This is because capital intensive and value added intensive stages are performed internally (designing, purchasing raw materials, cutting, ironing, labelling, distribution, etc.), and less value added tasks such as sewing and labour intensive tasks are outsourced. The following figures indicate the regular weekly cargo movements to and from Zaragoza airport.
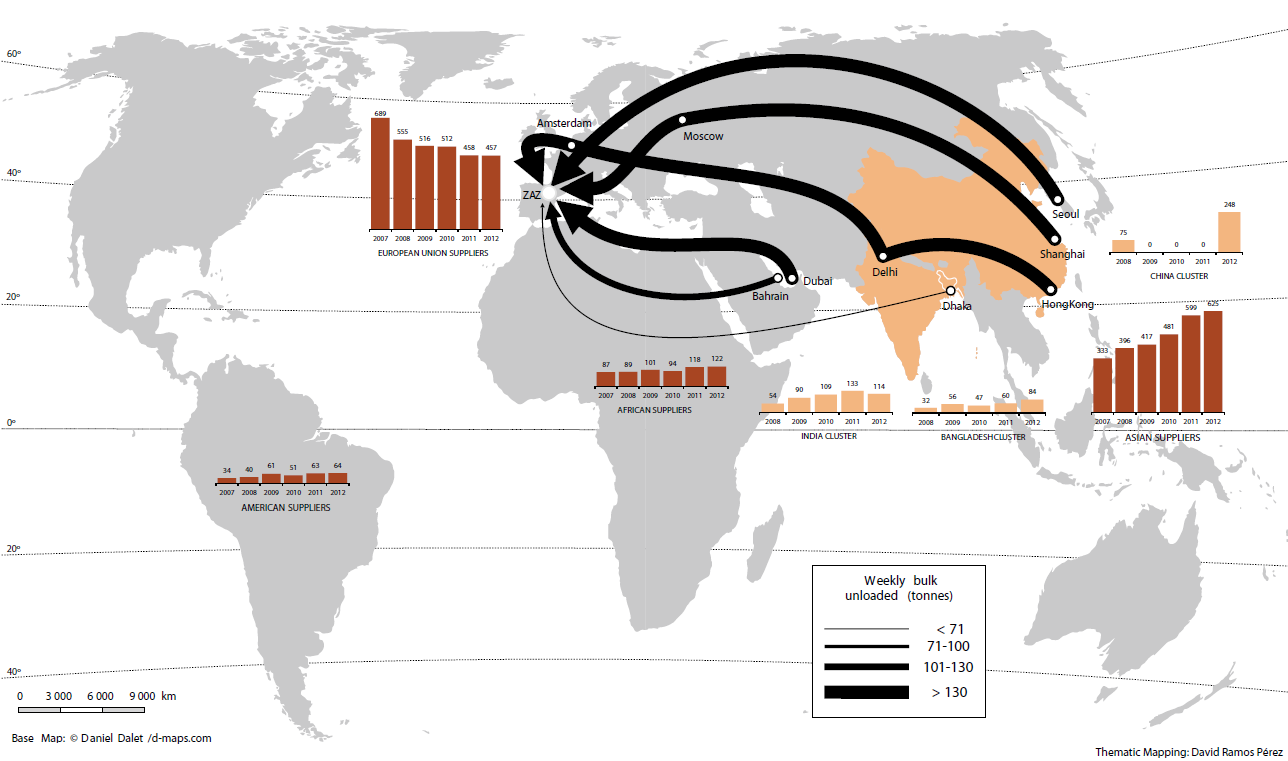 Weekly cargo received regularly at the Plataforma Europa in flights to Zaragoza airport
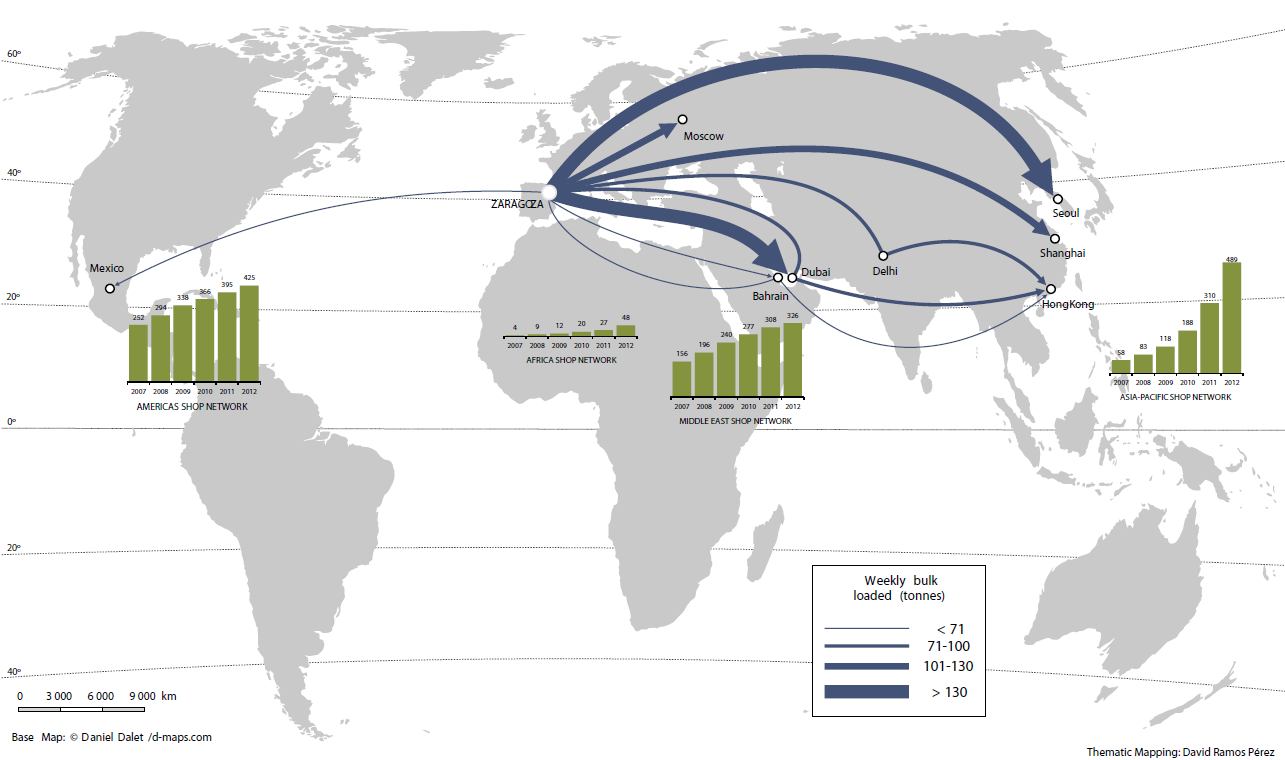 Weekly cargo sent regularly at the Plataforma Europa in flights from Zaragoza airport
This example looks at just one company, but what about the other big fashion retailers such as Nike, Adidas, H&M, and Marks and Spencer? Now you can imagine the level of cargo movement all over the world that occurs just for clothes.
Historical background of organic cotton
Until the early 20th century, the cultivation of cotton was organic, but the increased demand of a ‘cosmetically perfect produce’ caused the increased use of synthetic fertiliser and pesticides, which means that genetically modified cotton has emerged and rapidly grown to dominate the market.
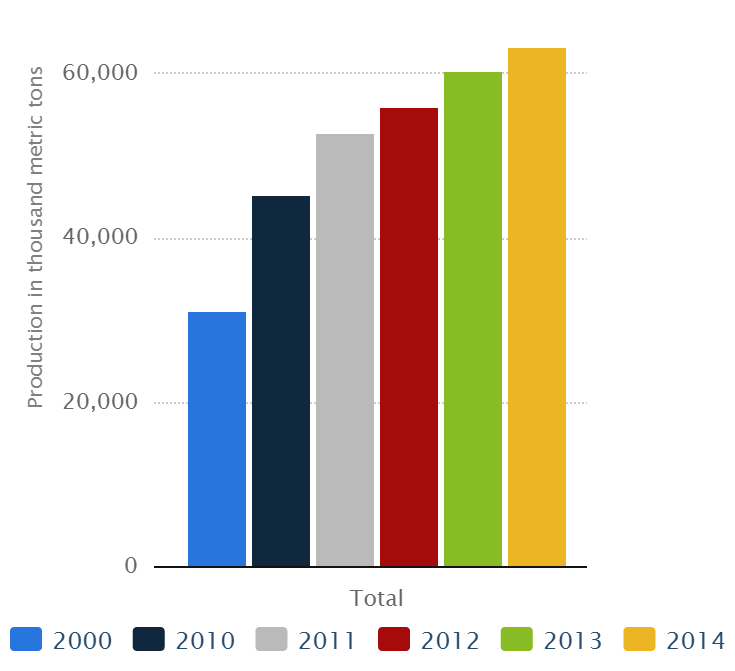 Global chemical fibre production from 2000 to 2014, by fiber type (in 1,000 metric tonnes)
After more than half a century of the expansion of these unorganic crops, people have now begun to recognise the environmental impacts of these practises. In 1985, the first international regulations on pesticides were introduced. New ‘organic pioneers’ launched cotton as a rational crop on specialised organic farms. This is known as the first reawakening of ‘organic cotton’. Since 1992, environmental awareness has become more intense within the fashion industry and the public in general, with some companies and apparel designers launching eco-friendly ranges. In 1994, a crisis in the market almost led to the death of the unorganic industry, especially in the USA. According to Ton, in 2002 the production fell by a staggering 50 per cent, hence the awareness of organic growing. In the early 2000s, a rekindling of sustainability and all the related products emerged, resulting in a huge expansion in design, range and quality of organic business. The Government, media and the general public became increasingly aware of the environmental impacts of human behaviour. This in turn boosted the organic cotton industry. Nevertheless, the demand of organic cotton fluctuated and in turn influenced the revenue of production.
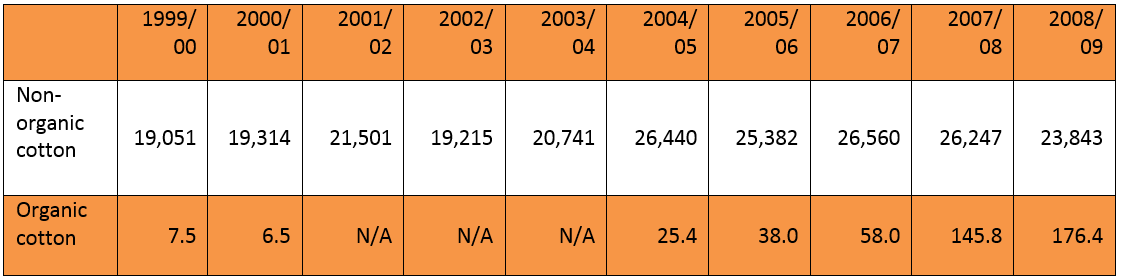 Cotton production worldwide (in thousand tonnes)
From here, the production worldwide of organic cotton increased almost by 3000% between 1999 and 2007, and it is predicted that the demand will continue to grow, despite the fall in supply.
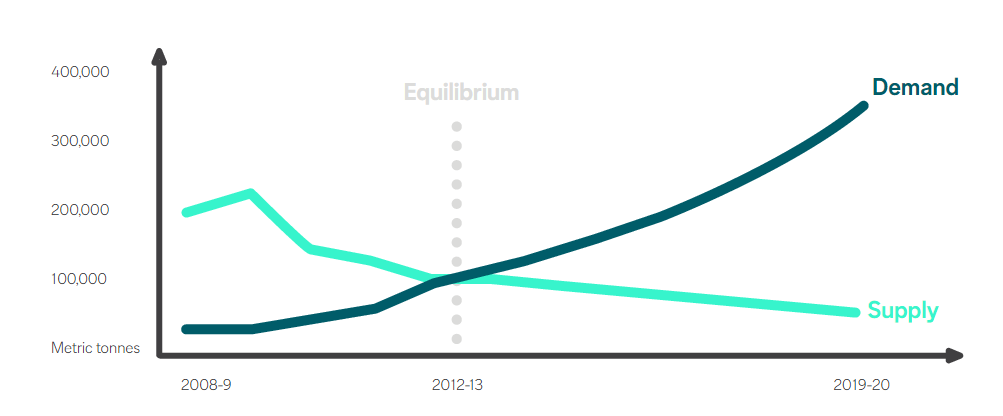 Supply and demand of organic cotton
In 2001, global retail sales of organic cotton stood at $245m, rising in 2008 to – representing only 0.1% of the total clothing market worldwide (all fibres).
Why do people prefer conventional cotton?
So, why do people still prefer conventional cotton, even though it damages and pollutes the natural ecosystem?
“As an example, it has been estimated that only 0.1% of applied pesticides reach the target pests, leaving the remaining 99.9% to impact the environment . Pimentel (1997) showed that the environmental costs of using pesticides in the US alone may be as high as $9 billion a year, and also calculated that for every $1 spent on pesticides, the achievable profits of $3–5 were counteracted by environmental costs of $3“
A Value Chain Analysis of the Organic Cotton Industry in India
This section presents the value chain of organic cotton industry in India in April 2007. Each stage will distinguish between organic cotton, certified organic cotton, and a conventional cotton T-shirt.
The farming stage
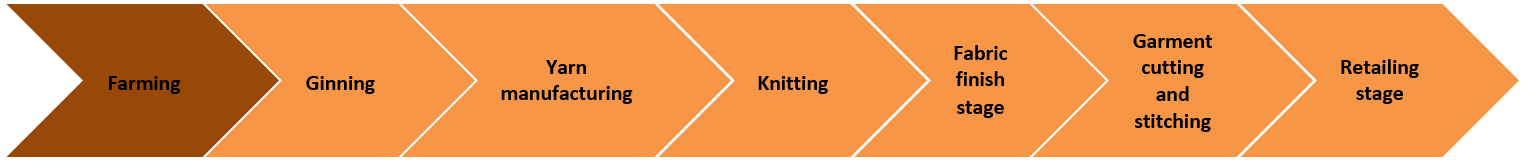
As you can imagine, the farming stage is the most crucial stage in organic cotton fibre production. At this stage, direct costs of normal cotton crops involve the purchasing of equipment, farmland (fixed cost) and labour, and raw materials such as seeds, water, and chemicals (variable costs). Additionally, organic products need indirect costs such as promotion and politicising.
Using India as an example, many farmers don’t have an educational background, and this makes experiences difficult to share. The worst ‘costs’ to conventional cotton farmers are the effects on health and wellbeing. Much of the time, farmers use pesticides to prevent pests, weeds, and diseases during production. According to People Tree agricultural chemicals can take up to 60 per cent of a farmer’s budget, and, as a result, in Punjab, between 1990 and 2007, 40,000 farmers committed suicide, because they could not pay back loans which they had taken out.
On the other hand, Indian organic cotton tends to use up to 65% less labour for pest management, although more labour hours are used for weeding and applying fertiliser. The variable costs are between 13 per cent and 20 per cent lower. Hence, incomes are ten to 20 per cent higher in organic production. India is the second largest producer of cotton worldwide, producing of the world’s cotton.
The ginning phase
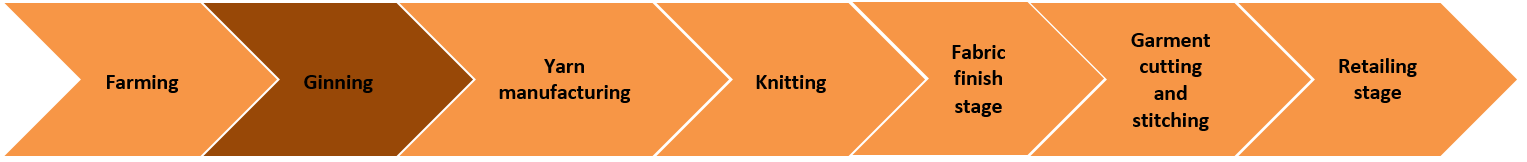 This process removes seeds from cotton fibres and there is no difference between organic and conventional cotton production at this stage. To get a full organic certification, the mill (producers) have to process and store organic cotton separately from non-organic crops. This process also creates by-products such as cotton seed oil and cattle feed, which is produced after the seed is separated from the lint, thus this could also be sold under an organic certificate.
The yarn manufacturing stage
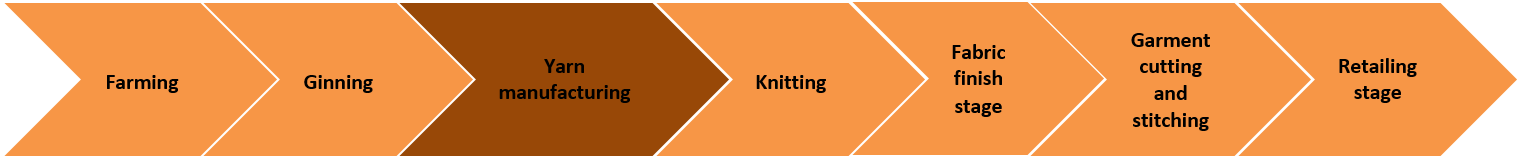 This stage in production has sub-processes such as leaning, mixing, carding, combing, drafting, twisting, and winding. Again, there is no difference between methods for organic and conventional cotton.
The fabric manufacturing/knitting stage
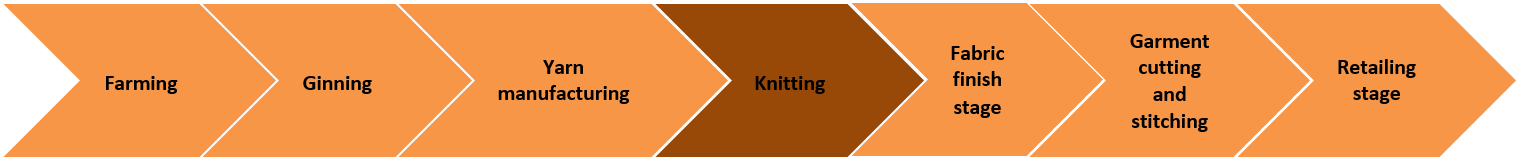 The aim of this mechanical process is to create a fabric from the yarn. There is no difference between organic cotton knitting and conventional cotton knitting, except for certified organic cotton, which does not allow oils to be used that contain heavy metals or other contaminating materials in the knitting process.
The fabric finishing stage
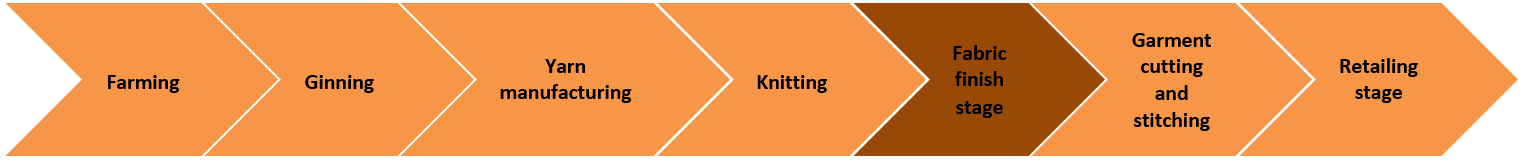 This is the final stage before the cotton garment is cut and stitched; it involves dying, printing, and mercerising amongst other processes. There are no regulations or standards of finish in regards to organic cotton products, which is why independent organisations have their own standards and methods of finish. It could be argued that finished fabrics are not properly organic.
Garment cutting and stitching
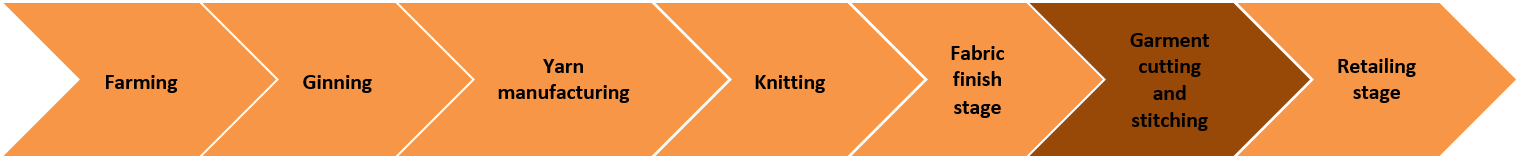 This is the final production stage before finished clothes are sent to distribution retailers. Like before, there is no difference between organic and conventional cotton at this stage. This process produces a serious fabric wastage, which causes the price of organic cotton to rise, due to the higher cost of the raw material.
Conventional and organic cotton are separated when stored because normal cotton sometimes contains formaldehyde, which could contaminate the organic products and therefore render them inorganic.
The retailing stage
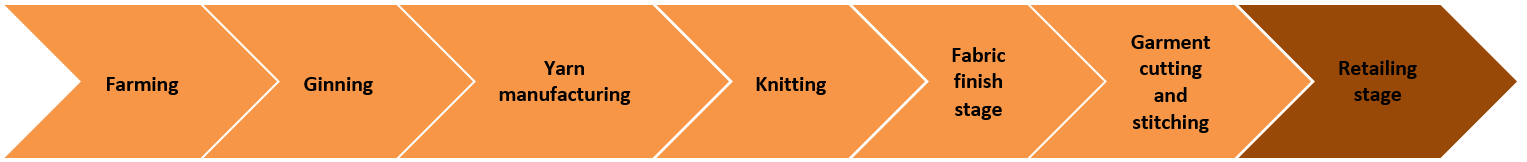 Using an example from July 2007, an organic t-shirt could be bought for $4.71 (£3.30) and a conventional cotton t-shirt for $3.17 (£2.22) from UK intermediaries such as Poeticgem.
There are different categories of retailers who are offering organic cotton:
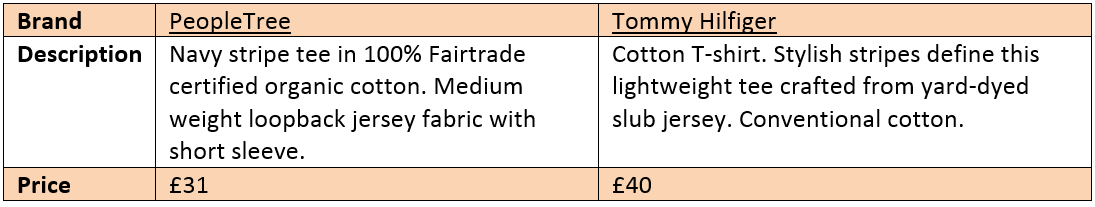
Category C: Such as H&M or Marks and Spencer; organic products are not their core range. They buy organic fabric and fibre and process it to their own standards. This means that the product is only certified at the farming stage. For example, a t-shirt costs around £21 (£9.50 more expensive than a normal cotton T-shirt).
Category E: Such as PeopleTree or Green Apple; organic products are their core range. All stages are certified. A t-shirt is priced at around £31 (£19.50 higher than normal cotton).
Organic VS Conventional Cotton
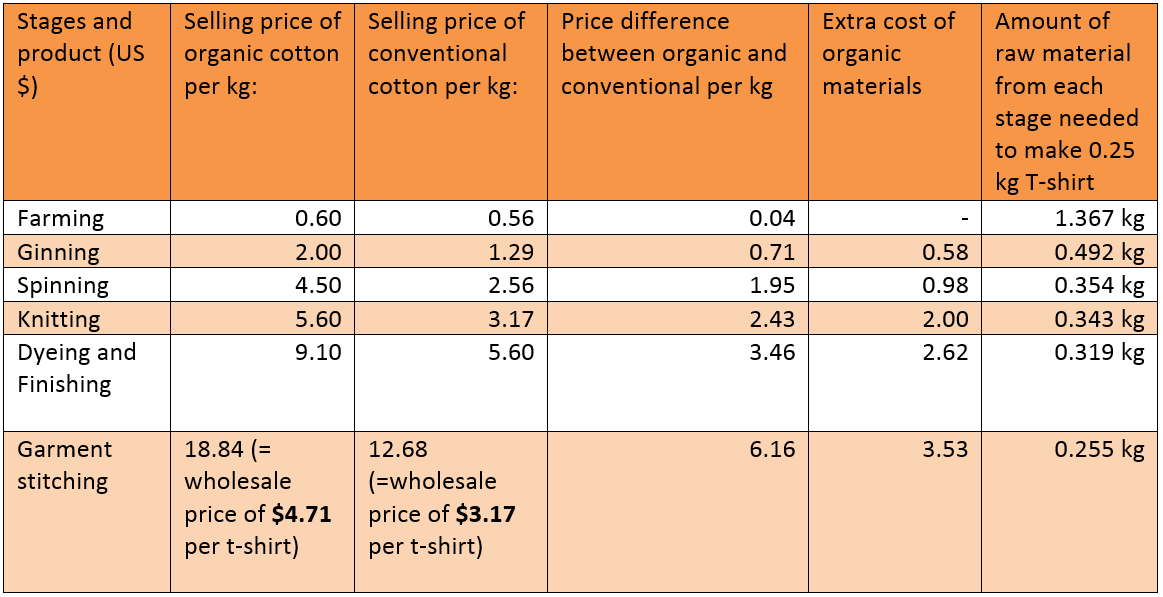 Value addition at each stage of cotton production
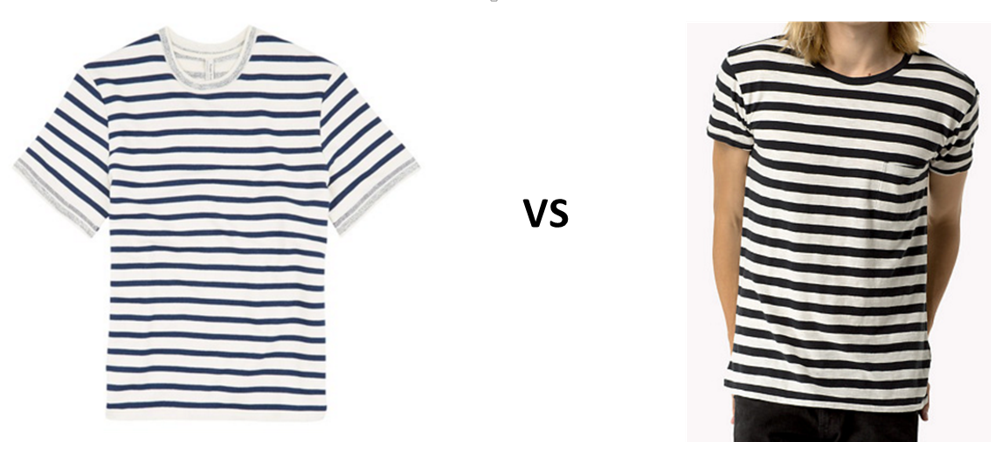
Do you see any difference? Probably not, despite the cotton difference: they look the same, and probably feel the same too.
Life Cycle Assessment
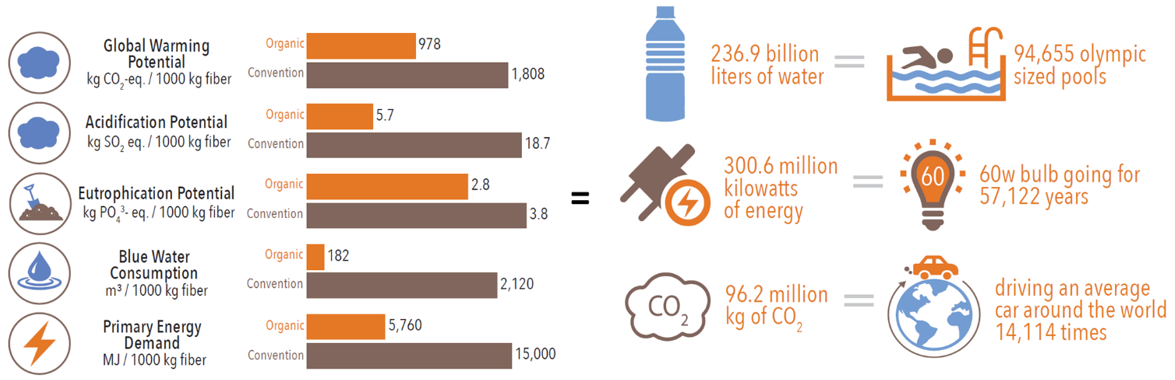 Life Cycle Assessment organic vs conventional
Conclusion
As shown in the previous examples, fast fashion is a common strategy in fashion retailing that produces tight schedules and short product life cycles. Cheaper clothing leads to a throwaway culture, or a situation where we have wardrobes full of clothes we no longer wear. Conventional cotton fits into this strategy well.
On the other hand, organic cotton adds value at each stage of the production process, and yields both environmental and social benefits. As shown in the above figures, organic cotton industries will affect the scope of retailing industries that is at the same time a benefit for the producers (as most of them are in developing countries).
In the long-term, organic farming will lower the pest management costs, which reduces farm debts and helps to increase yields. C&A and H&M lead the industry with long term commitments to organic cotton. Since 2014 the top 10 brands (such as C&A, H&M, and Tchibo) used 39,950 mt of organic fibres. Hence, Category C retailers might become the biggest consumers of organic cotton.
The next phase of organic movement worldwide is Organic 3.0, which breaks organic out of its niche status. Organic 3.0 is based on the principles of Health and Ecology with the adoption of organic farming, a sustainable environment, and animal husbandry carried out with care.
But nowadays there is another problem; the supply is significantly lower than the demand for organic, because the production is not keeping pace. That’s why the next step of organic movement is absolutely necessary, before it is too late.
Featured image credit: Pixabay